
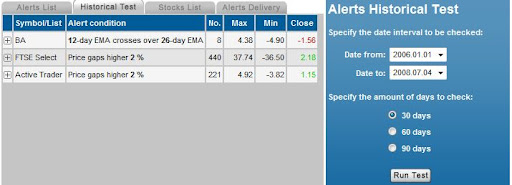
Again, the two stocklists comprise the following stocks:
Active Trader (US): AAPL, BA, C, CAT, CSCO, DIS, GM, HPQ, IBM, INTC, IP, JPM, KO, MSFT, SBUX, T, WMT
FTSE Select (UK): AGA_L, AVE_L, BB_L, BUR_L, COLT_L, CSR_L, DDT_L, DEB_L, DRX_L, FCAM_L, GFS_L, GNS_L, HIK_L, ISAT_L, LAD_L, LSE_L, MCRO_L, MGNS_L, NFDS_L, PFC_L, PFG_L, PNN_L, RGU_L, RRS_L, SCHE_L, TATE_L, TLW_L, UKC_L
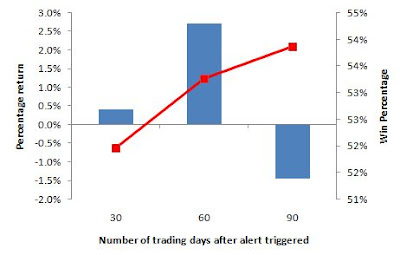
The average return of stocks on the FTSE select was more variable than from the US Active trader list. For the FTSE the best return was obtained after 60 trading days, but this reversed to a loss after 90 trading days.
FTSE Select 30-, 60-, 90-day return
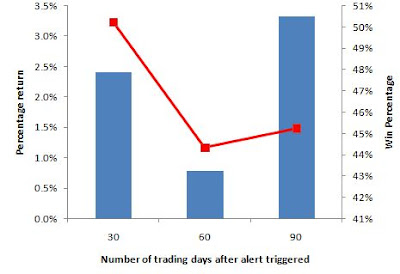
The Active Trader list was profitable over all time frames, but the best return was found after 30 trading days if the additional gains at 90 days were ignored because of the added time:
Active Trader 30-, 60-, 90-day return
For the maximum and minimum returns, these reflect the difference in the trigger price and the highest (or lowest) close over the 30-, 60-, and 90-day period. The Active Trader list returned an average maximum (closing) gain of 10.3%, 16.0% and 19.7% and an average maximum (closing) loss of -8.0%, -12.6% and -15.0% for the three time periods. The corresponding return for FTSE Select list was lower; with gains over the three time periods of +6.9%, +12.7%, and +14.2% and losses of -6.6%, -9.6%, and -13.4%.
The win percentage of the FTSE alert was a respectable 52% or higher, with the Active Trader showing a slighlty lower win percentage at 50% after 30 days, dropping to 45% after 90 days.
The next Strategy Lab on the blog will investigate using a 2% gap to enter a trade and selling on a 10% profit using different stop strategies.
Dr. Declan Fallon, Senior Market Technician, Zignals.com the free stock alerts, market alerts, and stock charts website
No comments:
Post a Comment