Friday, August 1, 2008

Advanced Alert: 2% Gap and new 120-day high

With the launch of the new Advanced Alerts feature I did a historical test for a combination alert for a 2% breakout gap on a new 120-day high.


Note when creating an Advanced Alert it is necessary to create the individual component alerts before they can be combined as an Advanced Alert. Also, alerts for stocks can't be combined with those for stocklists.

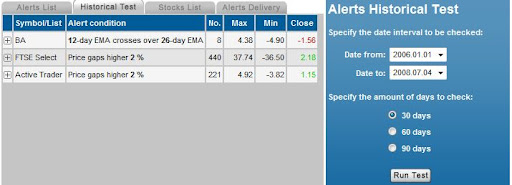
Back to the test. I used the traditional bag of stocks:

Active Trader (US): AAPL, BA, C, CAT, CSCO, DIS, GM, HPQ, IBM, INTC, IP, JPM, KO, MSFT, SBUX, T, WMT

FTSE Select (UK): AGA_L, AVE_L, BB_L, BUR_L, COLT_L, CSR_L, DDT_L, DEB_L, DRX_L, FCAM_L, GFS_L, GNS_L, HIK_L, ISAT_L, LAD_L, LSE_L, MCRO_L, MGNS_L, NFDS_L, PFC_L, PFG_L, PNN_L, RGU_L, RRS_L, SCHE_L, TATE_L, TLW_L, UKC_L

Test Period: Jan 1st 2006 to Aug 1st 2008.

What is immediately apparent is the combination alert of the 2% gap and 120-day high together performed worse for US stocks than the component alerts did independently. There was no performance advantage using these two alerts in combination for UK stocks, but there was no disadvantage either.

In terms of the price range over the 1-, 2-, and 3-month periods; the Advanced Alert for U.S. stocks returned an average maximum gain of 5.8% to 17.4% from the trigger date, with maximum losses ranging from -15.3% to -21.3%. There was a more even spread across U.K. stocks with a maximum gain in the 6.2% to 12.1% range and a maximum loss of -6.7% to -10.7%.

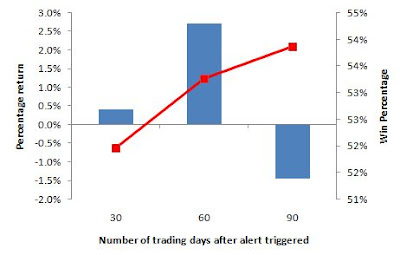
FTSE Select 1-, 2-, and 3-month returns:


Closing returns for U.K. stocks rose over time, although gains were minimal - even after 3 months.

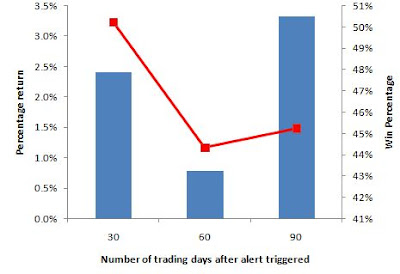
Active Trader Select 1-, 2-, and 3-month returns:


A horrendous short term performance over 1 month for U.S. stocks gave way to flat returns over subsequent 2 and 3 months.

Overall, this particularly combination of alerts was not one to set the world alight. There may even be reason to see this as a shorting play - although further testing involving proper risk management would be needed to confirm.

Dr. Declan Fallon, Senior Market Technician, Zignals.com the free stock alerts, market alerts, and stock charts website

Tuesday, July 22, 2008

Stock Alert: 50-day MA cross of 200-day MA

A stock alert strategy buying a 2% gap tested very successfully when combined with a stop, using the average maximum gain as a profit target. It's success was in large part attributed to the low number of trades generated, minimizing churn.

To take this to the next level I tested the traditional 50-day MA cross of the 200-day MA as 'buy' signal; what kind of performance can we expect from this stock alert strategy?


The stocks comprising the historical test were:

Active Trader (US): AAPL, BA, C, CAT, CSCO, DIS, GM, HPQ, IBM, INTC, IP, JPM, KO, MSFT, SBUX, T, WMT

FTSE Select (UK): AGA_L, AVE_L, BB_L, BUR_L, COLT_L, CSR_L, DDT_L, DEB_L, DRX_L, FCAM_L, GFS_L, GNS_L, HIK_L, ISAT_L, LAD_L, LSE_L, MCRO_L, MGNS_L, NFDS_L, PFC_L, PFG_L, PNN_L, RGU_L, RRS_L, SCHE_L, TATE_L, TLW_L, UKC_L

Test period: 30, 60 and 90 trading days.

The FTSE group of stocks performed erratically; the maximum gain ranged from 6 to 13%, but the range for losses was also comparable at -9 to -13%. Consequently, there was very little edge over the three test periods

FTSE Select 30-, 60-, 90-day return


The Active Trader list performed far better with consistently higher gains over time; the gains ranged from 7% to 15% with losses a more manageable -5 to -8%. The win percentage was also very respectable in the 63% to 67% range.

Active Trader Select 30-, 60-, 90-day return


The next strategy lab will look into the performance of this strategy with a 15% profit target and a range of protective stops from 3% to 8%. How will it perform against the returns from the 2% breakout gap strategy? This will be my next blog article.

Dr. Declan Fallon, Senior Market Technician, Zignals.com the free stock alerts, market alerts, and stock charts website

Friday, July 4, 2008

Sample alert: 2% Upside gap

The latest Historical stock alert test looks at the 30-,60-, and 90-trading day performance of stocks which gap 2% on my two test stocklists.


Again, the two stocklists comprise the following stocks:

Active Trader (US): AAPL, BA, C, CAT, CSCO, DIS, GM, HPQ, IBM, INTC, IP, JPM, KO, MSFT, SBUX, T, WMT

FTSE Select (UK): AGA_L, AVE_L, BB_L, BUR_L, COLT_L, CSR_L, DDT_L, DEB_L, DRX_L, FCAM_L, GFS_L, GNS_L, HIK_L, ISAT_L, LAD_L, LSE_L, MCRO_L, MGNS_L, NFDS_L, PFC_L, PFG_L, PNN_L, RGU_L, RRS_L, SCHE_L, TATE_L, TLW_L, UKC_L

The average return of stocks on the FTSE select was more variable than from the US Active trader list. For the FTSE the best return was obtained after 60 trading days, but this reversed to a loss after 90 trading days.

FTSE Select 30-, 60-, 90-day return


The Active Trader list was profitable over all time frames, but the best return was found after 30 trading days if the additional gains at 90 days were ignored because of the added time:

Active Trader 30-, 60-, 90-day return


For the maximum and minimum returns, these reflect the difference in the trigger price and the highest (or lowest) close over the 30-, 60-, and 90-day period. The Active Trader list returned an average maximum (closing) gain of 10.3%, 16.0% and 19.7% and an average maximum (closing) loss of -8.0%, -12.6% and -15.0% for the three time periods. The corresponding return for FTSE Select list was lower; with gains over the three time periods of +6.9%, +12.7%, and +14.2% and losses of -6.6%, -9.6%, and -13.4%.

The win percentage of the FTSE alert was a respectable 52% or higher, with the Active Trader showing a slighlty lower win percentage at 50% after 30 days, dropping to 45% after 90 days.

The next Strategy Lab on the blog will investigate using a 2% gap to enter a trade and selling on a 10% profit using different stop strategies.

Dr. Declan Fallon, Senior Market Technician, Zignals.com the free stock alerts, market alerts, and stock charts website

Tuesday, June 24, 2008

Sample alert: bullish 5-day EMA cross of 10-day EMA

On Friday I posted results of a crossover system using a 5-day exponential moving average (EMA) and a 10-day exponential moving average (EMA). The current test utlises the Zignals historical test feature of stock alerts to study returns over a 30-, 60-, and 90-day period for the same signal crossovers. Two sets of stock lists were used, each of which can be copied as the user wishes:

Active Trader (US): AAPL, BA, C, CAT, CSCO, DIS, GM, HPQ, IBM, INTC, IP, JPM, KO, MSFT, SBUX, T, WMT

FTSE Select (UK): AGA_L, AVE_L, BB_L, BUR_L, COLT_L, CSR_L, DDT_L, DEB_L, DRX_L, FCAM_L, GFS_L, GNS_L, HIK_L, ISAT_L, LAD_L, LSE_L, MCRO_L, MGNS_L, NFDS_L, PFC_L, PFG_L, PNN_L, RGU_L, RRS_L, SCHE_L, TATE_L, TLW_L, UKC_L

When these stocklists were run against the aforementioned moving average crossover strategy the following returns were achieved over 30-days:


The overall figure represents the maximum, minimum and average gain for all of the component stocklist stocks. To get results for individual stocks one only has to click on the [+]. For example in AAPL there were 20 trades, 70% of which were profitable:


It needs to be noted the Max/Min/Close quoted for FTSE traded stocks is in pence, whereas US stock prices are given in dollars. The following two charts show the 30-, 60-, and 90-day return for an upside cross of the 5-day EMA on the 10-day EMA. What is readily apparent is the poor performance of FTSE stocks compared to US listed stocks - although US stocks could hardly be accused of been strong performers; eeking out 2.7% over a 90-day period.

FTSE returns over 30-,60-, and 90-day


Active Trader returns over 30-,60-, and 90-day


Both the win percentage and the time-period returns were lower than buying a 20-day high, but is this the best way forward? Join today and try your stock alerts.

Dr. Declan Fallon, Senior Market Technician, Zignals.com the free stock alerts, market alerts, and stock charts website

Thursday, June 12, 2008

Sample alert: 20-day high; timed returns

In my recent strategy lab I looked at the performance of buying a new 20-day high and selling a 20-day low. In this article I will look at the timed return of buying a 20-day high and holding for a fixed period of time.

Zignals alerts has a Historical Test feature which gives a snapshot performance of an alert over a customizable timeframe, with the facility to study each individual occurrence of your alert within that timeframe.

For this historical test, two stock lists were used:

Active Trader (US): AAPL, BA, C, CAT, CSCO, DIS, GM, HPQ, IBM, INTC, IP, JPM, KO, MSFT, SBUX, T, WMT

FTSE Select (UK): AGA_L, AVE_L, BB_L, BUR_L, COLT_L, CSR_L, DDT_L, DEB_L, DRX_L, FCAM_L, GFS_L, GNS_L, HIK_L, ISAT_L, LAD_L, LSE_L, MCRO_L, MGNS_L, NFDS_L, PFC_L, PFG_L, PNN_L, RGU_L, RRS_L, SCHE_L, TATE_L, TLW_L, UKC_L


When creating your own stock lists it is perhaps better to limit your content stocks to fewer than 20; a large number of stocks means a larger number of alert triggers which may become unmanageable.

By selecting the Historical Test tab it is possible to see the overall return over 30, 60, and 90 days and is preconfigured for two years (but can backtest as far back as 2000). The figure below shows the return for our alerts over 30-days:


It should be noted the Maximium, Minimum and Closing value represents an average price for all component stocks of your list. Stocks on the FTSE are priced in pence and those on Active Trader list are priced in dollars, so the corresponding values will reflect this difference.

The Historical Test tool will give you a snapshot as to whether an alert has the potential to be profitable over a given period of time. In order to express this as a percentage return one needs to know the average price of the component stocks in your stock list over the historical test period. In the current case, stocks on the Active Trader list had an average value of $47.72 and those on the FTSE list of 549p (for the period Jan 1st 2006 to June 12th 2008). By expressing the Max / Min / Close price as a percentage of these values one can calculate the % Return. By studying the individual cases of each alert it is also possible to calculate a percentage win.

For the FTSE alert over 30, 60 and 90 days the average return was between 0.7 and 2.0% (including winners and losers):


For the Active Trader list over the same time frame the average return was between 1.6% and 4.1% (including winners and losers):


With a win percentage around 60% this is a reasonably respectable return for a fixed holding period of 60 or 90 days.

Dr. Declan Fallon, Senior Market Technician, Zignals.com the free stock alerts, market alerts, and stock charts website

Tuesday, June 10, 2008

LSE Alert: Soco International

After enduring a 6-month decline from its highs in November 2007, Soco International (SIA_L) is attempting a new rally. The kick from the April low got an additional boost with the recent upgrade of the stock by Citigroup from 'Neutral' to a 'Buy'. The early Zignals ascending channel was negated on its loss of support and the downward push past the 20-day MA. A fresh channel may emerge from the April-June lows.


Dr. Declan Fallon, Senior Market Technician, Zignals.com the free stock alerts, market alerts, and stock charts website

LSE Alert: DRAX Group

Drax Group (DRX.L) jumped 5%, pushing the stock out of a short term downtrend and maintaining support of the 20-day moving average. At 734p the stock has cleared the bulk of 2007 and 2008 resistance, with 2006 highs at 866p next on the radar. There was no company specific news to account for the breakout.


Dr. Declan Fallon, Senior Market Technician, Zignals.com the free stock alerts, market alerts, and stock charts website